Tim Hegemann, M.Sc.

Lehrstuhl für Informatik I
Universität Würzburg
Am Hubland
D-97074 Würzburg
Raum: 01.006, Gebäude M4
Forschungsinteressen
- Visualisierung von industriellen Netzwerken
- Überschneidungsfreie Platzierung von Labels
Projekte
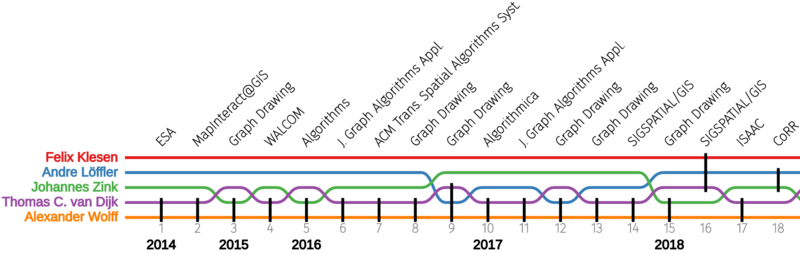
Storylines with a Protagonist
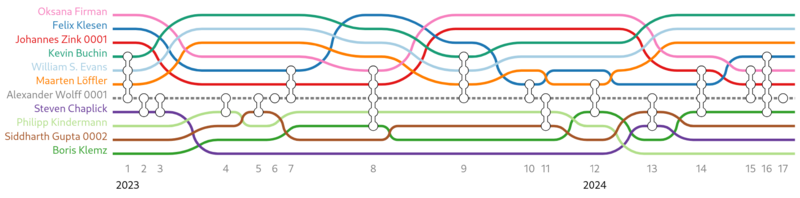
Visualize joint publications with your coauthors over time (open interactive version).
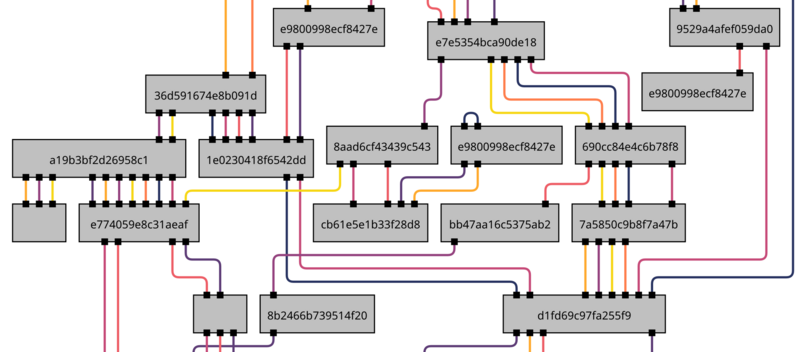
Graph Harverster

Extract graphs from vector drawings in pdfs. Master's project of Julius Deynet supervised by Sebastian Kempf, Alexander Wolff, and myself.
ZiNsVis
Platzsparende Visualisierung großer industrieller Netzwerke (Projektseite).
Publines
Master's thesis project of Tim Herrmann supervised by Felix Klesen, Alexander Wolff, and myself.
See it in action!
Auszeichnungen
- 2024: 1. Platz bei der Graph Drawing Live Challenge in der manuellen Kategorie auf dem 32nd International Symposium on Graph Drawing and Network Visualization (GD'24) in Wien, gemeinsam mit Johannes Zink
- 2023: 1. Platz bei der Graph Drawing Live Challenge in der manuellen Kategorie auf dem 31st International Symposium on Graph Drawing and Network Visualization (GD'23) in Palermo, gemeinsam mit Florentina Voboril und Johannes Zink
Betreute Abschlussarbeiten und Praktika
- Jan Sauer: Chord-Diagramme mit partiellen Knotenvorgaben
(Masterpraktikum), 2026
pdf - Vasil Alistarov: Improving the Readability of the ChordLink Model
(Masterarbeit), 2025
pdf - Julius Deynet: Graph Harvester
(Masterpraktikum), 2025
pdf - Nina Kamphowe: Visualisierung von Prozessgraphen im Rahmen des Process Mining
(Bachelorarbeit), 2024
pdf - León Lang: Generierung von schönen Graphzeichnungen mit Kreisbögen für Graphen mit zwei Knotenklassen
(Masterpraktikum), 2024
pdf - Sebastian Körner: Stauchung orthogonaler Graphenzeichnungen mithilfe komplexer Schnitte
(Bachelorarbeit), 2023
pdf - Arash Torabi Goodarzi: Crossing Reduction in Circular Layouts under Grouping Constraints
(Bachelorarbeit), 2022
pdf - Tobias Schopka: Generalisierung orthogonal gezeichneter Pläne
(Bachelorarbeit), 2022
pdf - Tim Herrmann: Storyline-Visualisierungen für wissenschaftliche Kollaborationsgraphen
(Masterarbeit), 2022
pdf
Lehre
Winter 2025/26:
- Exercises in Computational Geometry
Sommer 2022:
- Exercises in Visualization of Graphs
Veröffentlichungen
2026[ to top ]
-
Morphing graph drawings in the presence of point obstacles. . Journal of Computer and System Sciences, 157, H. Fernau; S. Gaspers; R. Klasing (Hrsg.), S. 103755. 2026.
2025[ to top ]
-
Universal Quality Metrics for Graph Drawings: Which Graphs Excite Us Most?. . In Graph Drawing and Network Visualization (GD), Bd. 357 von LIPIcs, F. Montecchiani, V. Dujmović (Hrsg.), S. 30:1–30:20. Schloss Dagstuhl – Leibniz-Zentrum für Informatik, 2025.
-
Optimizing Wiggle in Storylines. . In Graph Drawing and Network Visualization (GD), Bd. 357 von LIPIcs, F. Montecchiani, V. Dujmović (Hrsg.), S. 39:1–39:17. Schloss Dagstuhl – Leibniz-Zentrum für Informatik, 2025.
2024[ to top ]
-
Morphing Graph Drawings in the Presence of Point Obstacles. . In Proc. 50th Int. Conf. Current Trends Theory & Practice Comput. Sci. (SOFSEM’24), Bd. 14519 von Lecture Notes in Computer Science, H. Fernau, S. Gaspers, R. Klasing (Hrsg.), S. 240–254. Springer-Verlag, 2024.
-
Storylines with a Protagonist. . In Proc. 32nd Int. Symp. Graph Drawing & Network Vis. (GD’24), Bd. 320 von LIPIcs, S. 26:1–22. Schloss Dagstuhl – Leibniz-Zentrum für Informatik, 2024.
-
Graph Harvester (Software Abstract). . In Proc. 32nd Int. Symp. Graph Drawing & Network Vis. (GD’24), Bd. 320 von LIPIcs, S. 58:1–58:3. Schloss Dagstuhl – Leibniz-Zentrum für Informatik, 2024.
2023[ to top ]
-
A Simple Pipeline for Orthogonal Graph Drawing. . In Proc. 31st Int. Symp. Graph Drawing & Network Vis. (GD’23), von Lecture Notes in Computer Science, M. Bekos, M. Chimani (Hrsg.). Springer-Verlag, 2023.
2021[ to top ]
-
Aligning Polylines to Line Features on Bitmap Images of Historical Maps. Technical Report (Master thesis), . . Master thesis. University of Würzburg, Institut für Informatik, 2021.
2019[ to top ]
-
Relevanz der Codequalität in einem Praktikum mit automatisch getesteten Programmierabgaben. . In Proceedings of the Fourth Workshop "Automatische Bewertung von Programmieraufgaben" (ABP 2019), S. 27–34. Gesellschaft für Informatik e.V., 2019.
2018[ to top ]
-
Cross-Platform Evaluation of Performance Event Trigger. . Institut für Informatik, 2018, Juni.