ZiNsVis: Smart Visualization for Enhanced Accessibility of Industrial Networks
| Projekt Title: | ZiNsVis – Smart Visualization for Enhanced Accessibility of Industrial Networks |
| Status: | completed |
| Researchers: | Alexander Wolff (local PI), Tim Hegemann |
| Funding: | KMU-innovativ (Information and Communication Technologies), a funding scheme of the German Federal Ministry of Education and Research (BMBF) |
| Cooperation Partners: | Infosim GmbH & Co. KG, Würzburg denkbares GmbH, Würzburg |
| Term: | 2022-03-01 until 2025-02-28 (36 Months) |
Advancing digitization in business and industry means that data and processes are increasingly represented and used digitally. Examples of such data are communication structures or data flows in IT networks, industrial component structures, and functional networks of complex machines. For these types of data, graphs are a natural representation. ZiNsVis will develop suitable, customizable visualizations and interactions for such graphs to facilitate manual analysis and maintenance for users. This will help companies to better meet the challenges of digitization. In parallel, ZiNsVis will advance the scientific state of the art.
Main Results
The following sections provide a brief overview of the most important project results. The complete project report can be found here (in German), and a summary of the key points can be found here (in German).
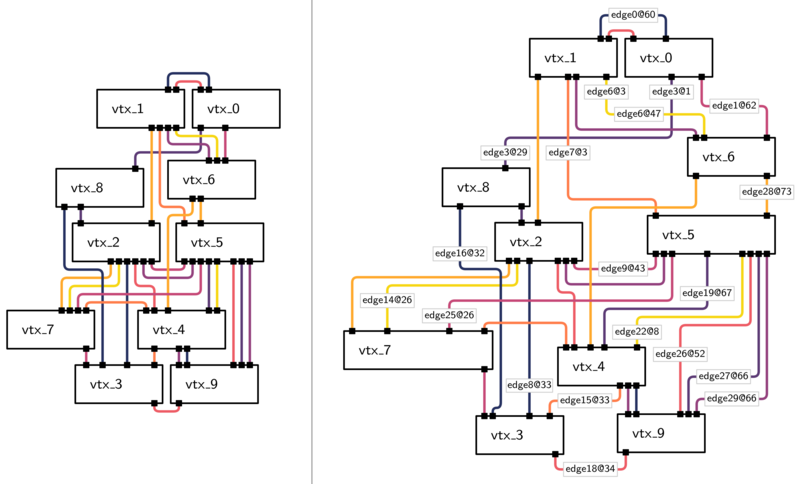
Labels in Orthogonal Drawings
In order to automatically draw orthogonal graphs, a flexible pipeline called WueOrtho was implemented in the project. WueOrtho consists of several interchangeable program components. We added a module to this pipeline that allows rectangular labels of any size to be added to an already drawn network without overlapping and with small additional space consumption. If labels (or other interactive elements) are requested by the user, they are displayed as needed. Here, the methodology of moving existing elements to make room for newly displayed elements achieved good results. This means that (1) the elements do not overlap, (2) the relative node positions are retained, i.e., arrangements (“node 4 is to the right of node 7”) that the user has memorized do not change, and (3) the drawing remains as compact as possible. The algorithms developed in the course of the project proved to be superior to established drawing methods in terms of the quality criteria we identified as particularly important (e.g., space consumption). With regard to other quality criteria (number of edge crossings and kinks), a relative tie was achieved [Hegemann, Wolff. GD'23].
Recommending Node Positions
A layer-based drawing algorithm [Zink, Walter, Baumeister, Wolff. Comp. Geo. 2022] was used to implement user-specified recommendations for node positions. If, for example, the positioning of certain nodes in the upper area of the drawing is desired, the algorithm is intervened such that these nodes are assigned to the upper layers when assigning horizontal layers. This is possible by assigning the corresponding direction to the edges. (Usually, a direction is assigned that results in a more homogeneous drawing if possible.)
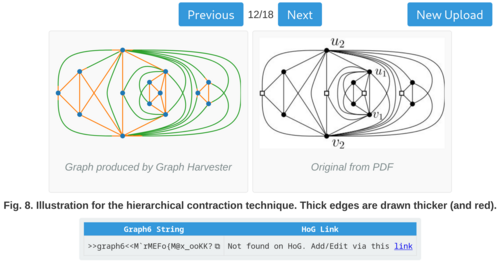
Interpreting Drawings
Another use case for which the persistence of drawings is essential is the analysis of existing (often hand-drawn) plans. For this purpose, a program was developed that recognizes images in certain common formats and analyzes them in terms of the graph they represent [Mooney, Hegemann, Wolff, Wybrow, Purchase. GD'25]. The geometry of the drawing is also stored, such as the shape and position of the nodes and the exact course of the edges.
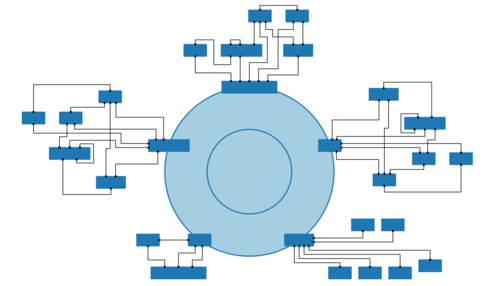
Algorithms for Hybrid Layout Methods
Drawing styles that implement domain-specific requirements (e.g., division into core and transmission networks in IT networks or main and secondary figures in figure networks) enable users to grasp key characteristics of the network at a glance. The figure shows an example of the combination of different drawing styles. An IT network could be drawn in a domain-specific style for the core and transmission network and then combined with an orthogonal drawing of the network periphery. The drawing algorithms used must maintain compatibility at the transfer points and be flexible in dealing with the areas drawn in the other style. Algorithms with these special properties were developed as proof-of-concept in the project.