Detection of the pressure wave of the Hunga Tonga volcanic eruption with the we4bee hives
21.01.2022In our project we4bee, we detected two main air pressure waves in Germany from the Tonga eruption. One from north to south, the second one a few hours later from south to north. We visualized pressure differences for our top bar hive for both waves and interpolated isobares from all locations in Germany.
On the morning of January 15th 2022 , the Hunga Tonga-Hunga Haʻapai submarine volcano erupted in the island nation of Tonga. According to initial findings, the eruption is the largest volcanic eruption of the 21st century. It caused tsunamis up to 15 meters high in many coastal regions of the world. The sonic boom was heard as far away as Alaska, which is 9700 km away [1].

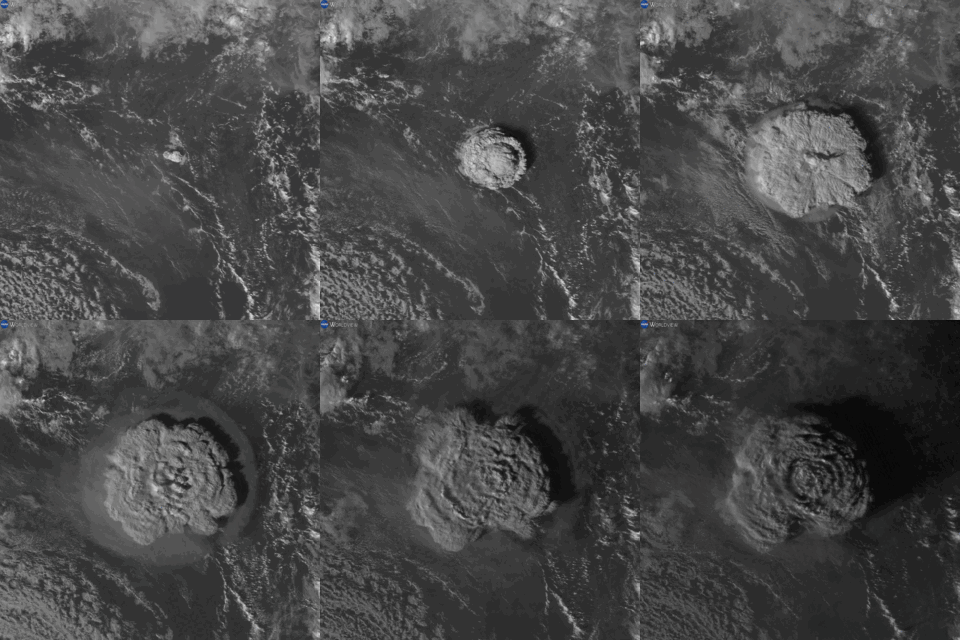
Satellite image of the initial ash plume and shock wave [2]
The blast wave of the eruption spread with more than 1000 kilometers per hour in all directions and could be recognized at first even on satellite images. It reached Germany from the north on January 15 in the evening. The changes in air pressure could be measured by weather stations all over Germany and thus the pressure wave could be followed. After the wave had traveled in a circle around the globe and had collided again at the geographic antipode Algeria, a return wave could be observed a few hours later from the south direction [1].
In addition to official weather stations, the we4bee project funded by the Bavarian Ministry of Digital Affairs was also able to track the shock wave. The special feature here, however, is that the pressure sensors are housed in so-called "smart hives", which are located throughout Germany. In the project "we4bee - learning and researching with bees", the chair of Data Science primarily analyzes bee behavior with machine learning methods using sensor data; the air pressure sensors are one of many sensors available in the hive. Since the network of smart beehives extends over the whole federal territory, the pressure waves could be detected in a temporal context.
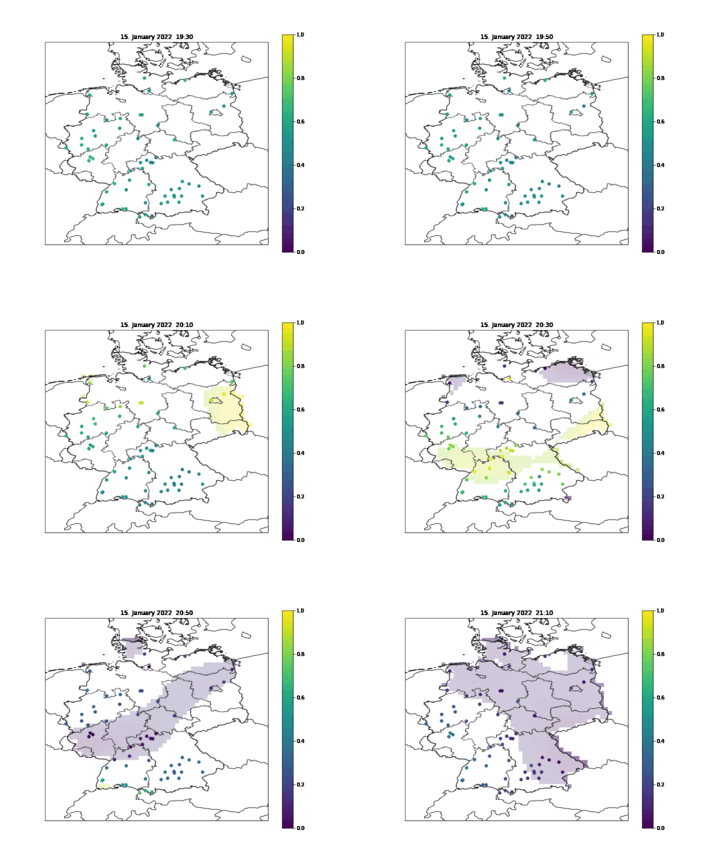
Figure 1: Animation of the first air pressure wave over Germany. Stationary points are the measured values of the hives, color gradients were determined by interpolation of the hive data. |
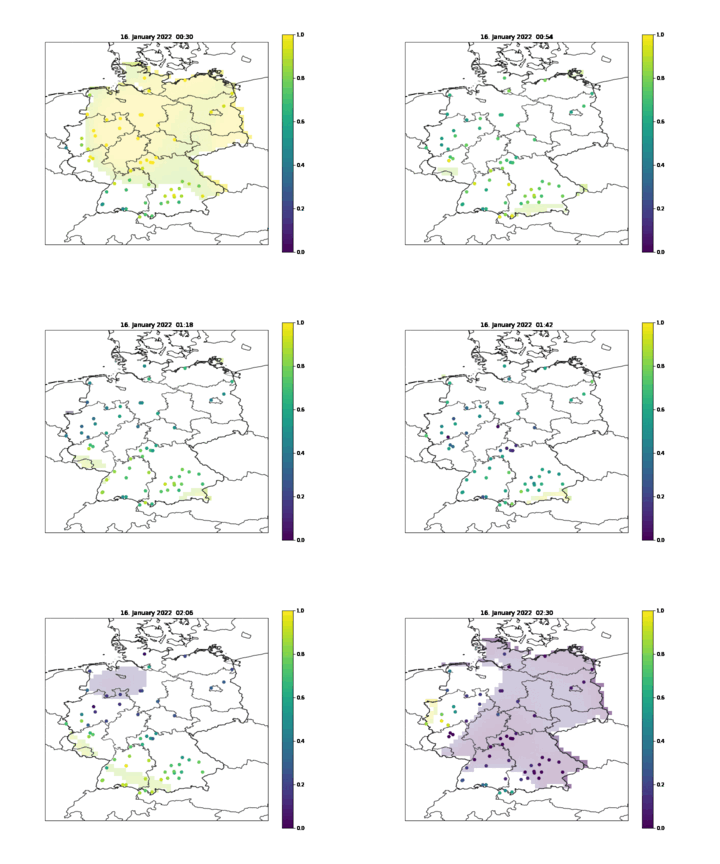
Figure 2: Animation of the second air pressure wave over Germany. Stationary points are the measured values of the hives, color gradients were determined by interpolation of the hive data. |
In the animations, the hive positions of we4bee can be seen as stationary points. The measured air pressure per hive was scaled over a period of about two hours so that the maximum air pressure is light yellow and the minimum air pressure is dark blue. Colored areas show a spatial interpolation to get an impression of the course of the wave between the hives. The pressure wave initially proceeded as a high pressure wave from north to south. Due to the high pressure, which compressed the air, not enough air could flow in afterwards, so that a low pressure wave could be observed afterwards. During the return wave a low pressure area could be observed, which moved from south to north.
One goal of the we4bee project is the early detection of earthquakes and other natural disasters with the help of the highly sensitive bio-sensor "bee" [3]. The fact that the smart beehives used for this purpose can detect the effects of the volcanic eruption shows the potential inherent in this project. A next step would now be to search for other unusual readings in the vicinity of the event. In the future, machine learning methods could automatically analyze and potentially predict such events or the behavior of the bees before and during such events.
Sources:
[1] https://www.dwd.de/DE/presse/hintergrundberichte/bericht_vulkan_hunga_Tonga.pdf.pdf?__blob=publicationFile&v=2
[3] https://twitter.com/we4bee


