New interactive Climate Atlas of Lower Franconia for the BigData@Geo website
02.12.2020The interactive web portal of the BigData@Geo project has been available since October 2018. After consultation with the cooperating small and medium-sized enterprises (SME), the portal has now been fundamentally revised.
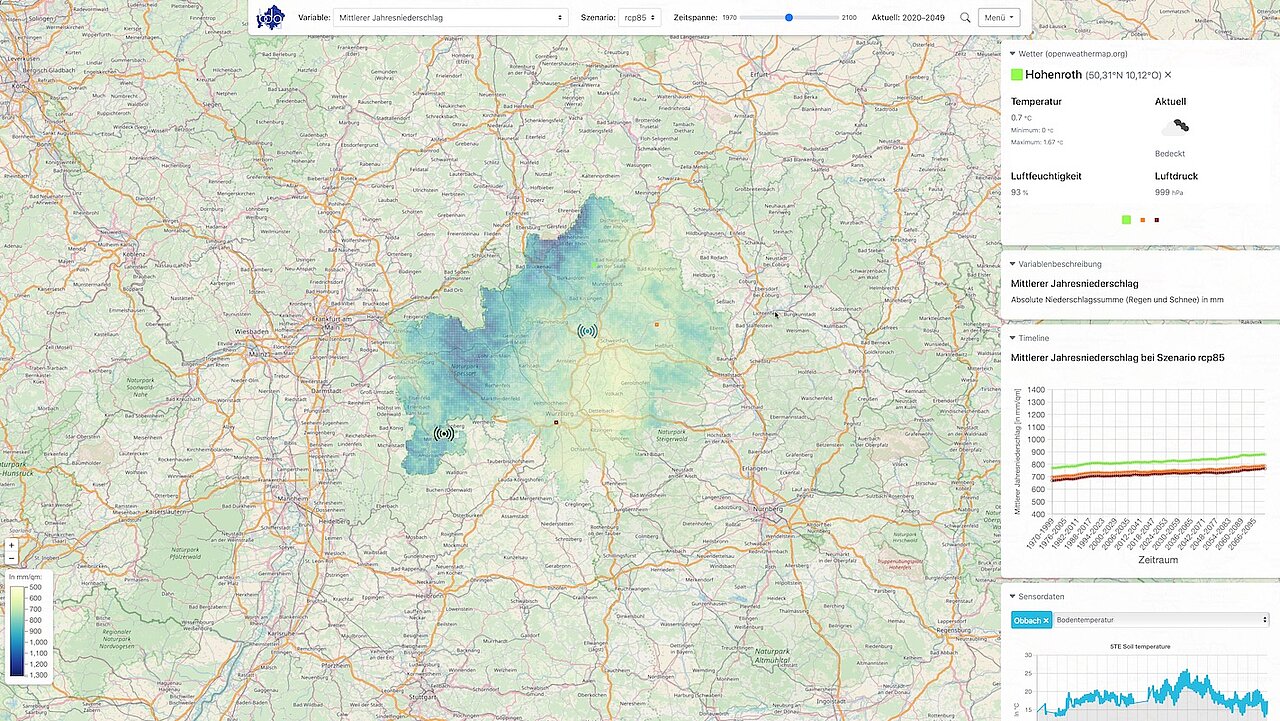
We have significantly overhauled the interactive web portal at the BigData@Geo website. In order to simplify a direct understanding of the portal's function, we have renamed it the "Lower Franconian Climate Atlas". If you are visiting the Climate Atlas for the first time, you will first be given instructions on how to use the site. The center of the webapp is the map view, which was previously only available as a widget. This view allows us to include all the relevant information that was considered important in a survey with the participating SMEs.
At the top of the webapp, the required variable, the greenhouse gas scenario and the time period can be selected, which then adjusts the map display. There a color grid over the map encodes the selected values. A sidebar displays useful information regarding the location and the variable values when clicking on a cell. Several cells can be selected with a right click to compare their values.
Ground measurement stations set up at different locations during the project are also shown on the map. The station data can be selected in the sidebar and viewed for a self-selected period of time.
In addition to the revised user interface, we have also improved the performance of the app. In the future we want to improve the user experience on mobile devices, among other things.